Homebuyer Activity Remains Robust Amidst Shifting Market Trends
Lisa Mailhot | July 27, 2023
Buyers

Lisa Mailhot | July 27, 2023
Buyers
Despite the housing market no longer experiencing the frenzy seen in the past couple of years, the current market is far from stagnant. In fact, buyer activity remains robust.
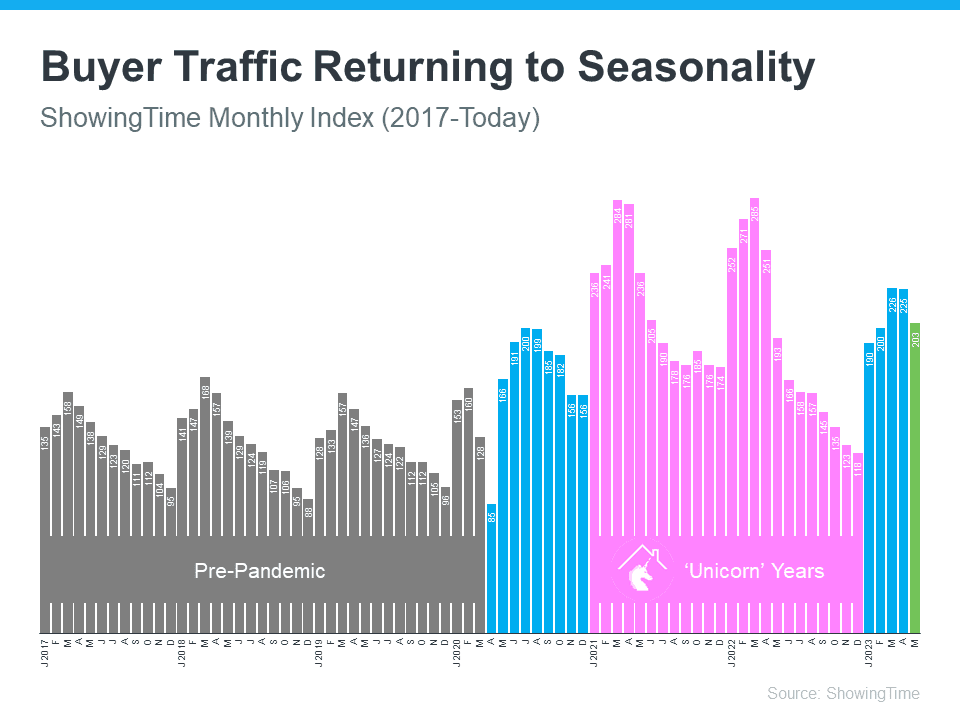
The ShowingTime Showing Index serves as a metric to gauge the level of home tours conducted by buyers. The graph presented below utilizes this index to depict buyer activity trends over time, aiding in providing a clear understanding of the current situation.
The data reveals a clear seasonality in the real estate market. Looking at the previous normal years (depicted in gray), a consistent pattern emerges, with buyer activity peaking in the first half of each year, particularly during the spring's peak homebuying season, and gradually slowing down towards the end of each year.
However, when the pandemic emerged in March 2020, this trend was disrupted as the market reacted to the uncertainty (shown in blue in the middle). Subsequently, we experienced the 'unicorn' years of housing (shown in pink), characterized by historically low mortgage rates and a surge in buyer demand. Remarkably, even during this period, similar seasonal trends persisted, but at significantly higher levels.
Now, turning our attention to the year 2023, we observe a decrease in traffic compared to the previous month, and it is also lower than the peaks witnessed during the 'unicorn' years. However, this decline in traffic does not indicate a sharp decrease in demand; rather, it reflects a gradual transition towards a more typical seasonal pattern. As elucidated in the ShowingTime report:
“Showing traffic declined about 10% in May . . . This follows a typical seasonal pattern – disrupted by the pandemic but now beginning to return . . .”
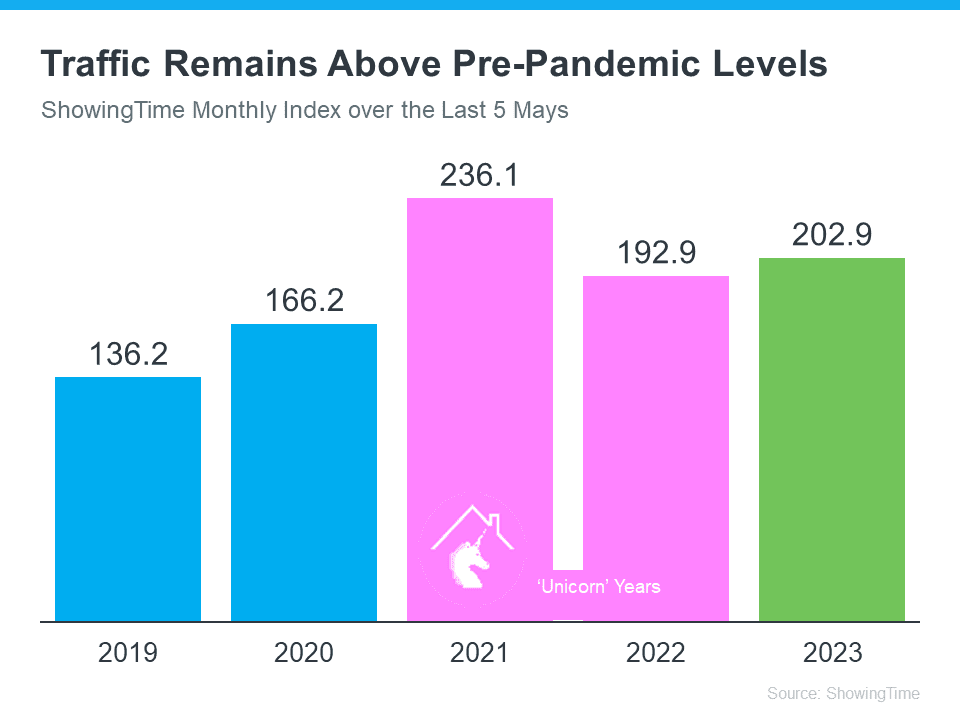
To emphasize that the decline is not significant, let's take a closer look. Below is a graph that focuses solely on the May data from the past five years, vividly demonstrating the continued strength of buyer demand.
Buyers are actively touring homes, displaying more engagement than in May 2022 (when higher mortgage rates caused some sticker shock) and certainly more than during the last normal years. Therefore, it's crucial to recognize that buyer activity remains robust. Additionally, this demand could be even stronger if not constrained by the limited supply of homes for sale, as mentioned by U.S. News:
“Housing markets have cooled slightly, but demand hasn’t disappeared, and in many places remains strong largely due to the shortage of homes on the market.”
The market remains highly active today. If your house is not on the market, it's missing out on the opportunity to attract the numerous buyers currently seeking to make a purchase. Let's connect to start the process.

Harvard's 2026 housing report reveals deep affordability struggles nationwide. Here's what it means for Orange County buyers and sellers.

Mortgage rates hover in the mid-6% range this June. Here's what buyers and sellers in Orange County need to know right now.

Home delistings hit near-record highs in April 2026. Learn what's driving sellers to pull listings and what it means for Orange County buyers and sellers.

Homeowners insurance premiums are climbing fast. Learn what's driving costs up and what it means for buyers and sellers in today's market.

Pending home sales drop for the second week as mortgage rates hit a 10-month high. Here's what it means for buyers and sellers today.

Housing affordability improved for 7 straight months. Learn what falling income requirements mean for buyers and sellers in Orange County and beyond.

Price cuts fell slightly in April 2026 as buyer demand rebounds. See what this means for Orange County buyers and sellers right now.

U.S. home prices rose 2.4% in April 2026, the biggest gain in 13 months. Here's what buyers and sellers in Orange County need to know now.

The U.S. housing market still favors buyers, but the gap is shrinking. Here's what April 2026 data means for Orange County.
Let's find a time that suits you best to chat about your goals, show you how we work, and figure out how we can help you the most
Get In Touch With Lisa

Broker Associate
949-877-7087
124 Tustin Ave Suite 200, Newport Beach, CA 92663